A world class factory, is a safer and more efficient factory
You want to go home at the end of the day knowing that you did everything you could to prevent an accident. Transform your factory with safety products to minimise that risk.
Frustrated with staff that won't change?
It is hard to work with (let alone manage!) employees who struggle to implement change in order to grow your company. Even when you know exactly what needs to happen, sometimes they just don't want to listen. Maybe all they need is a little inspiration....

Protect your Assets
Your people are your greatest asset

Improve Employee Engagement
Use boards to document data showing your employees exactly where you need to improve to hit your goals.

Gain Internal Knowledge in the right systems and processes
Consultancy and Management Coaching for business improvement, specific to the needs of your business.


Traditional factory fit-out products just don't meet the requirements of a 'World-Class' facility.
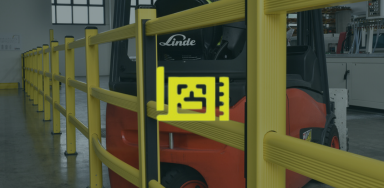
Steel barriers, traditional signage and undefined walkways fail to provide the safe working environment people expect.
This leads to the problems that most factory managers still have:
"We just can't seem to get people to stay"
"Our FLT's are constantly getting damaged from impacts with the steel barriers"
"Our team is not aligned on acceptable quality of work"
"We don't know if we are winning or losing"
"The maintenance team are constantly repairing the concrete where the bolts have ripped out" (From the steel barrier)
"We're basically operating 4S because we cant get it to sustain"
"Our operations team and Health & safety team are not aligned"
"We need to increase production, but don't have enough space"
Visual Management Makes Lean Work
At Clarity Visual Management, we are passionate about Lean and firmly believe that visual management is vital to its success.
We are on a mission to unleash the full power in our clients’ Lean programmes by effective and engaging visual management.
Gain an understanding of how you could make lean work in your business by watching this video.
"World-Class" begins with a mindset change

Old Way
New Way
Lack of visual management, leads to bored, disengaged employees
Worn-out factory signage is confusing
Material Handling Accidents cost more than money
You've given up on your Lean journey because you don't have full 'buy-in' from your team
Staff turnover is high and you struggle to retain your top talent
1. Discover your problem
This starts with an onsite assessment by one of our experts to gain an in-depth understanding of your vision. We then use our expertise in Lean consulting and Visual design to decide what you need for a Lean, Safe and Visual work environment.
2. Design your plan
We will then provide you with a completely bespoke proposal to reflect the components needed to make your vision come to life. A rough visual of the scope of work will be added into your proposal, and an official 3D visual will be provided after order, to ensure you are fully happy with the work to be carried out.
3. Deliver your solution
Finally, our project management team will work closely with you to arrange an installation date that suits your factory schedule. The product that was once just an idea, is transformed into reality.


Succeed with Clarity


Industries that value safety...

Choose Clarity for your workplace needs
Get in touch and speak with a Visual Management Specialist to answer any questions you may have on our products, consultancy or business.
